Based on the import and export data of China Customs, this report carries out multidimensional analysis from the overall import and export trend of medical devices, trade categories, trading partners, trading provinces and cities, etc., aiming at objectively evaluating the import and export trade trend and market pattern of medical devices in China, and providing certain data reference for relevant enterprises to establish project evaluation, market research, and channel expansion. The relevant data are from the global medical device big data service platform - medical device data. If you need all kinds of detailed data in the report, please go to the medicine, wisdom and medical equipment data, and the free experience of the database is attached at the end of the article.
I. Overall analysis
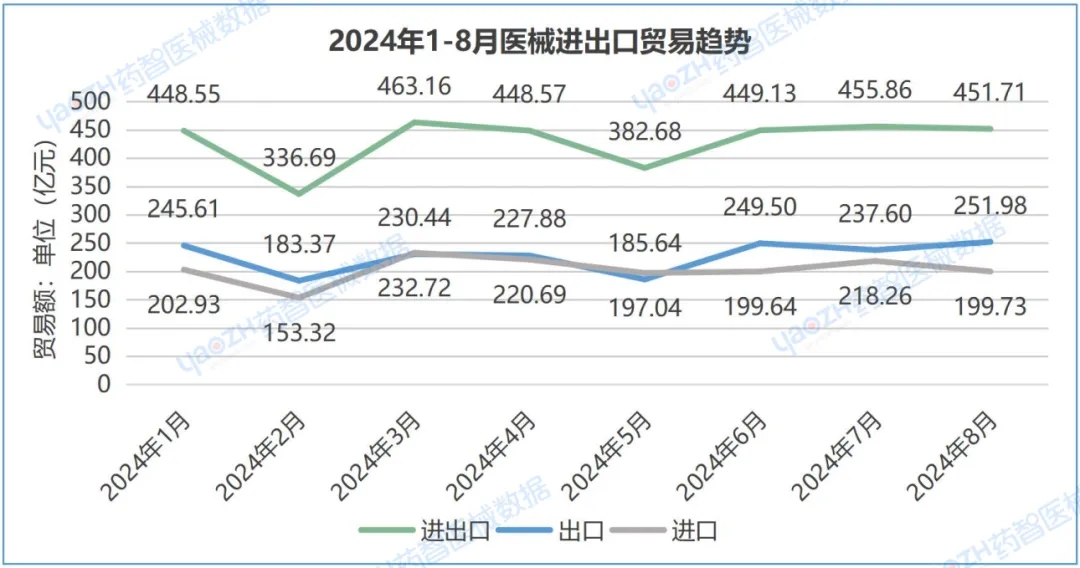
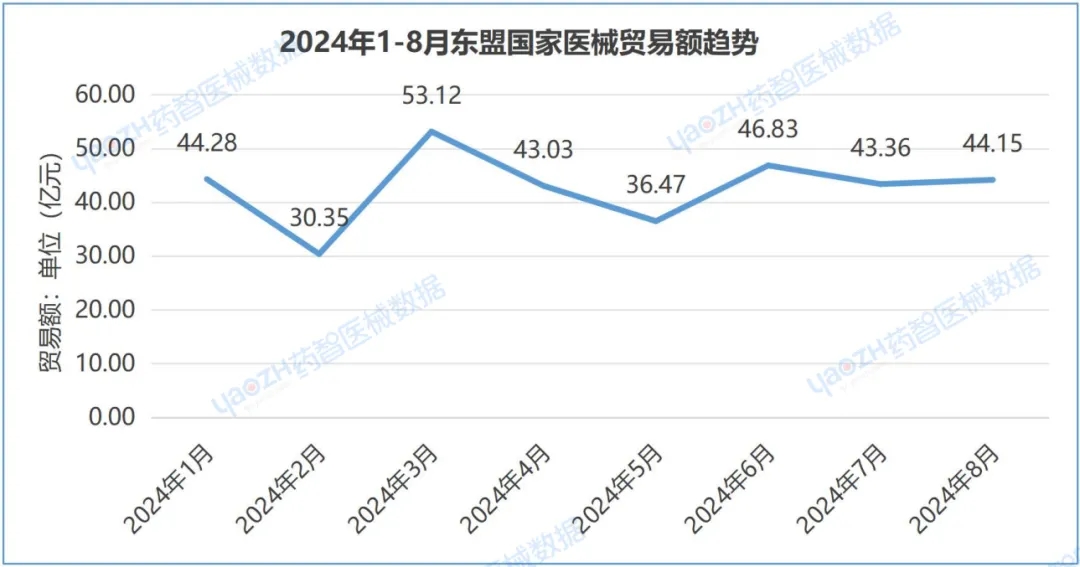
Overall, after the import and export trade picked up in March this year, the value of China's import and export trade was basically flat.

From the overall data from January to August 2024, in terms of exports, the Asian market is the largest export trade market, with a market share of 33.09%. In 2024, China's exports to RCEP countries, the Belt and Road Initiative and ASEAN will total 44.524 billion yuan, 47.502 billion yuan and 23.171 billion yuan respectively. Compared with 2023, RCEP countries fell 29.14%, "One Belt and One Road" fell 27.9%, ASEAN fell 27.76%, the main export of China's medical devices in 2024 is the United States, Japan, Germany, the United States is China's largest export trading country, accounting for 24.85% of China's export market. In 2024, the amount of China's export of medical consumables accounted for the highest proportion, reaching 45.48%. In China's foreign trade of medical devices, Guangdong Province is the largest exporter, with an export value of 47.961 billion yuan in 2024.
In terms of imports, the European market is the largest import trade market, with a market share of 42.85%. In August 2024, the main import places of China's medical devices are the United States, Germany and Japan, and the United States is China's largest import trading country, accounting for 22.82% of China's import market. In August 2024, the amount of medical equipment imported from China accounted for the highest proportion, reaching 44.90%. In China's medical device import trade, Shanghai is the largest import province, with an import value of 87.523 billion yuan in 2024.
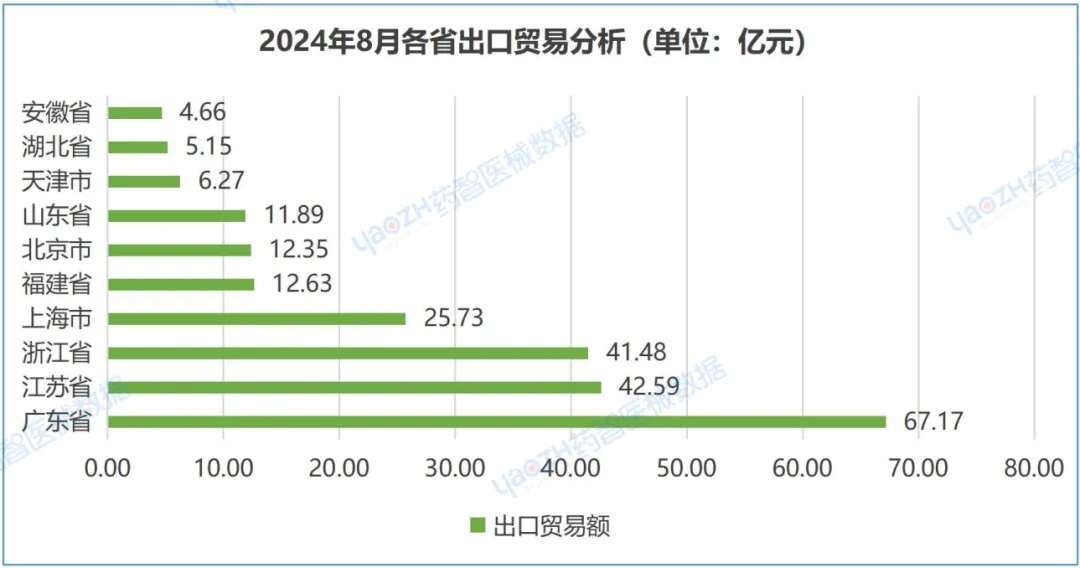
From the single month data of August 2024, in terms of exports, the Asian market was the largest export trade market in August 2024, with a market share of 30.65%. In August 2024, China's total exports to RCEP countries, the Belt and Road Initiative and ASEAN were 5.789 billion yuan, 6.209 billion yuan and 3.01 billion yuan respectively. Compared with July 2024, RCEP countries increased by 5.85%, "One Belt and One Road" increased by 2.8%, ASEAN increased by 5.72%, in August 2024, China's main export of medical devices for the United States, Germany, Japan, the United States is China's largest export trading country, accounting for 26.81% of China's export market. In August 2024, the amount of China's export of medical consumables accounted for the highest proportion, reaching 44.27%. In China's foreign trade of medical devices, Guangdong Province is the largest export province, with an export value of 6.717 billion yuan in August 2024.
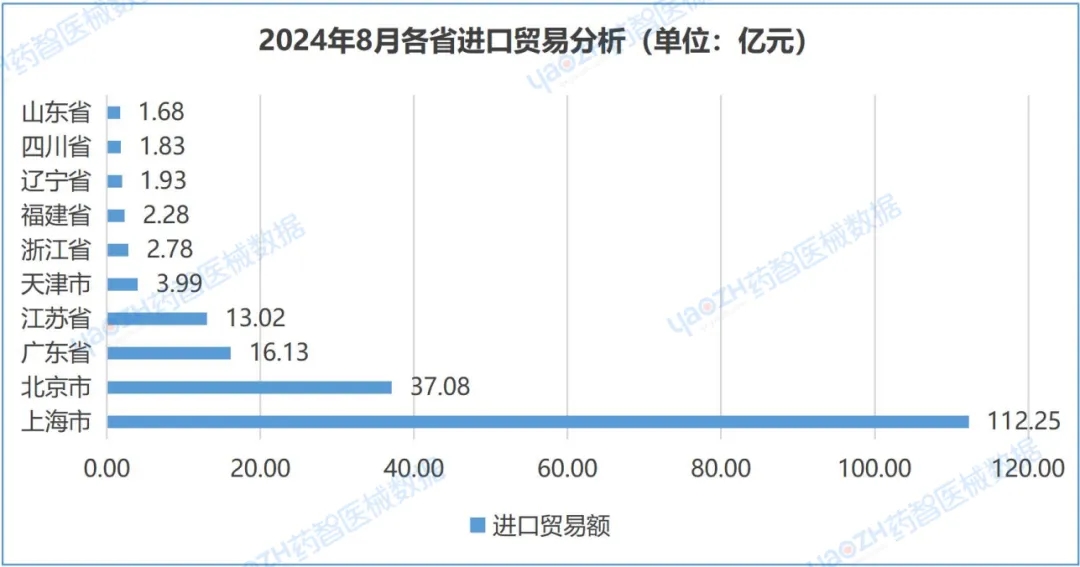
In terms of imports, the European market was the largest import trade market in August 2024, with a market share of 40.83%. In August 2024, the main import places of China's medical devices are the United States, Germany and Japan, and the United States is China's largest import trading country, accounting for 22.95% of China's import market. In August 2024, the amount of medical equipment imported from China accounted for the highest proportion, reaching 43.48%. In China's medical device import trade, Shanghai is the largest import province, with an import value of 11.225 billion yuan in August 2024.
1, from January to August 2024, details of China's medical equipment import and export trade
From January to August 2024, the average growth rate of China's import and export of equipment was 0.10%; The average value of exports increased by 0.37%; Imports fell by an average of 0.23 per cent.
2. Import and export volume of China's medical equipment registration places from January to August 2024 (Top 20)
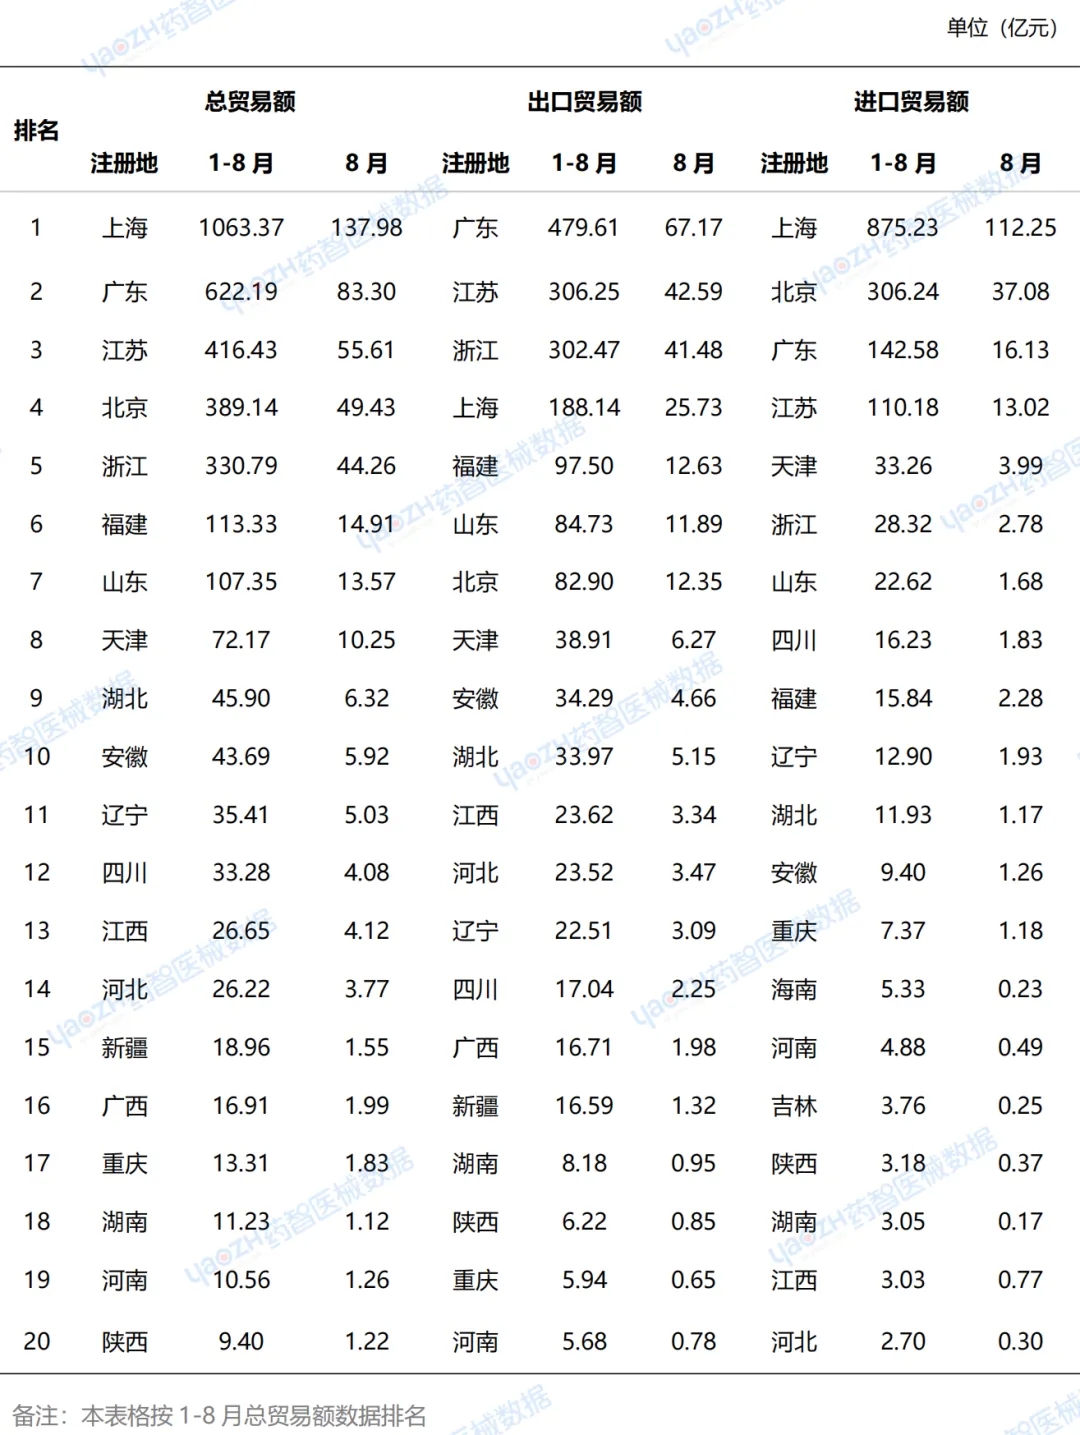
From the perspective of the total import and export trade volume of China's medical device registration places from January to August 2024, Shanghai, Guangdong and Jiangsu ranked the top three, of which Shanghai's total trade volume from January to August was 106.337 billion yuan.
2. Product analysis
1, From January to August 2024, China's import and export of various categories of medical equipment commodity trade deficit details
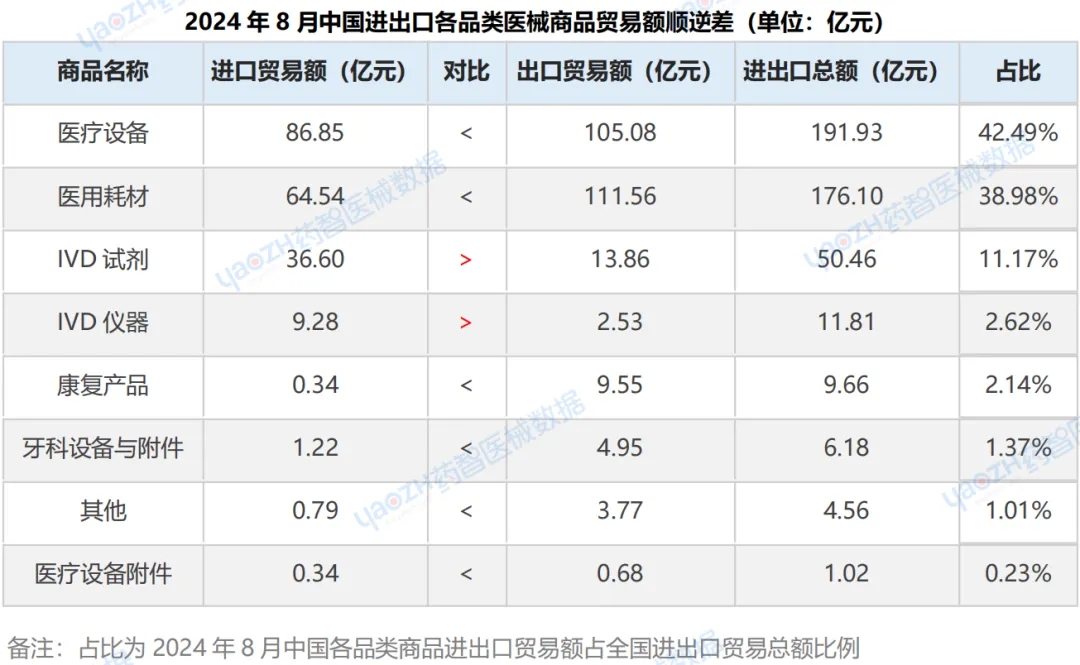
In August 2024, the import volume of IVD reagents and IVD instruments was greater than the export volume, and the remaining products were in surplus.
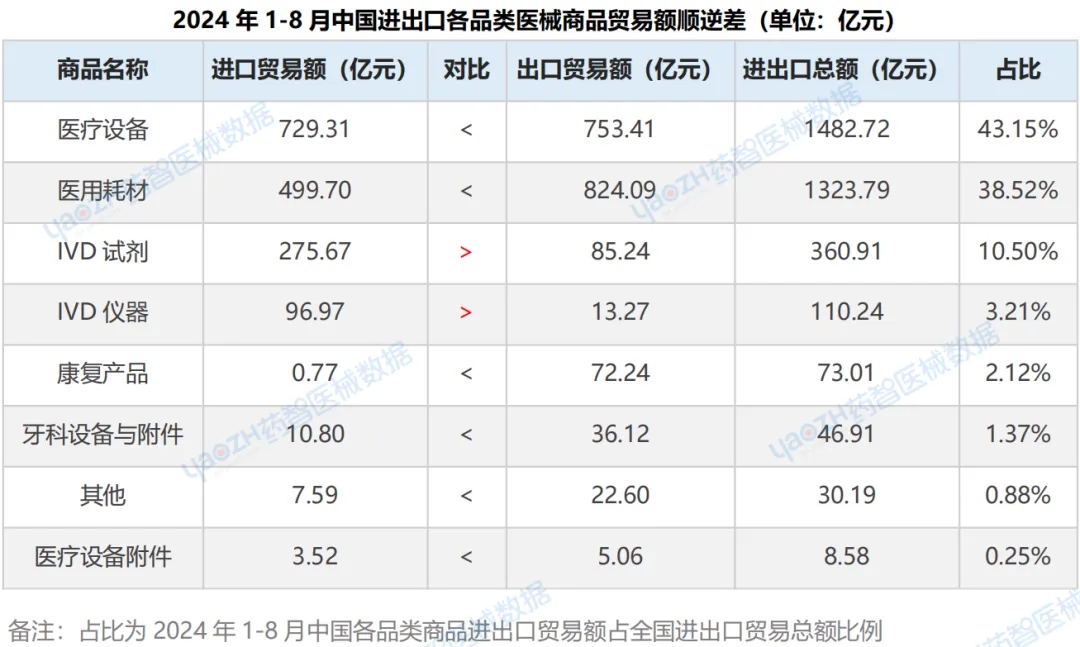
From January to August 2024, the import volume of IVD reagents and IVD instruments was greater than the export volume, and the rest of the products were in surplus.
2. Details of the top ten commodities in China's import and export volume of medical equipment in August 2024
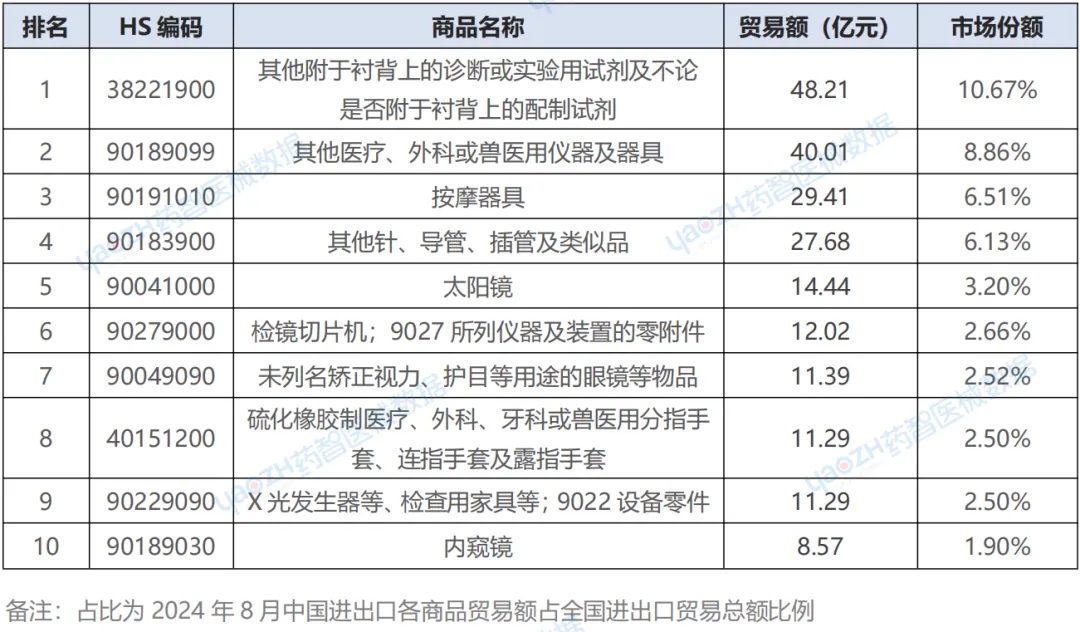
3. Trend analysis of the trade volume of main products from January to August 2024
From the analysis of the type of equipment, exports, in August 2024, China's export IVD instrument trade increased the most, its export value was 253 million yuan, an increase of 42.7%; The export value of medical consumables was the first, which was 11.156 billion yuan, an increase of 3.76%.
In terms of imports, the total trade volume of China's imported rehabilitation products increased the most in August 2024, and its import volume was 12 million yuan, an increase of 6% from the previous month; The import value of medical equipment was the first, at 8.685 billion yuan, down 10.95% from the previous quarter.
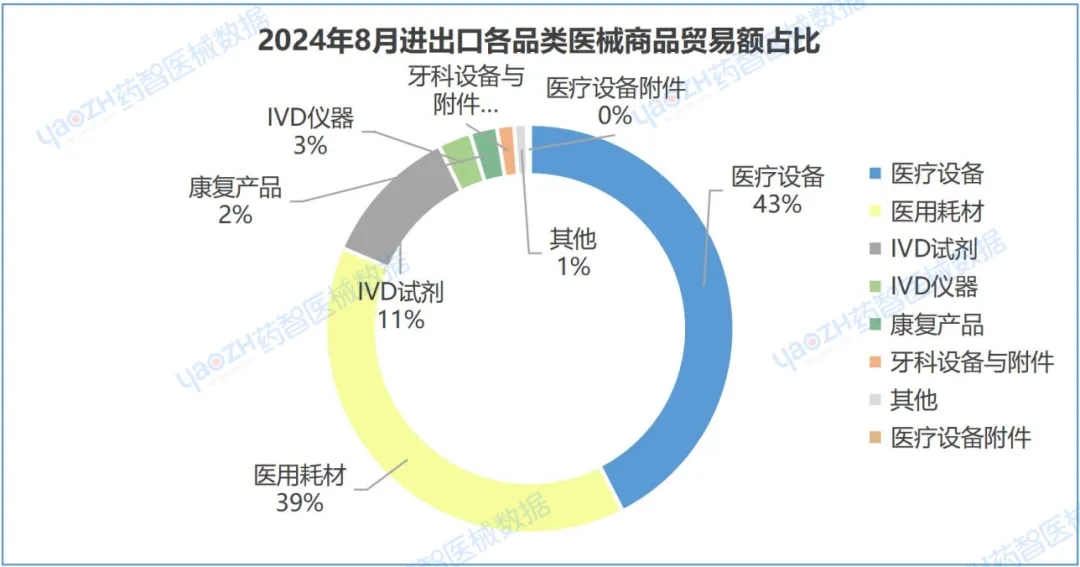
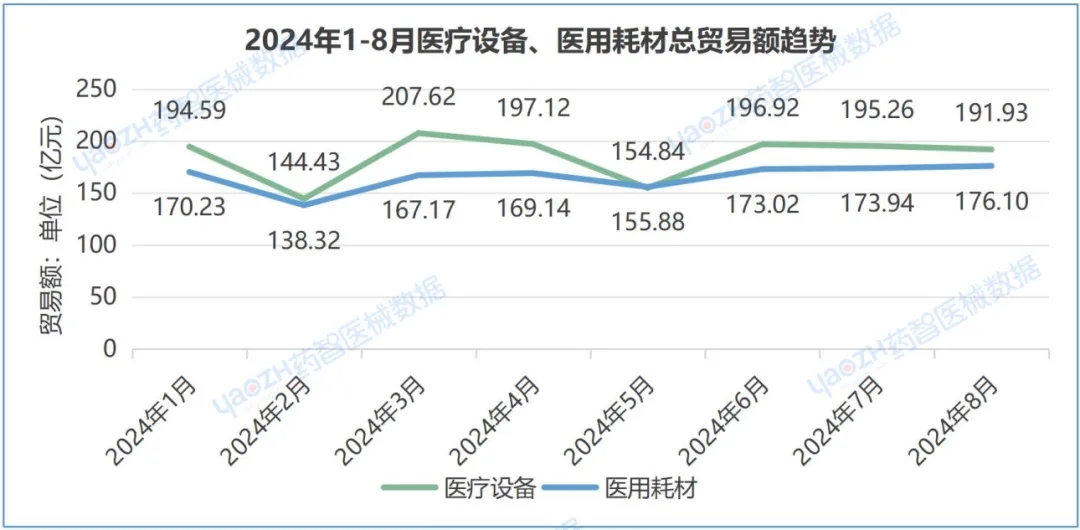
From the data of the total trade volume of major products, from January to August 2024, the trend of medical equipment and medical consumables is roughly the same, both falling in February 2024 and then rising.
Third, market analysis
1. Intercontinental trade pattern
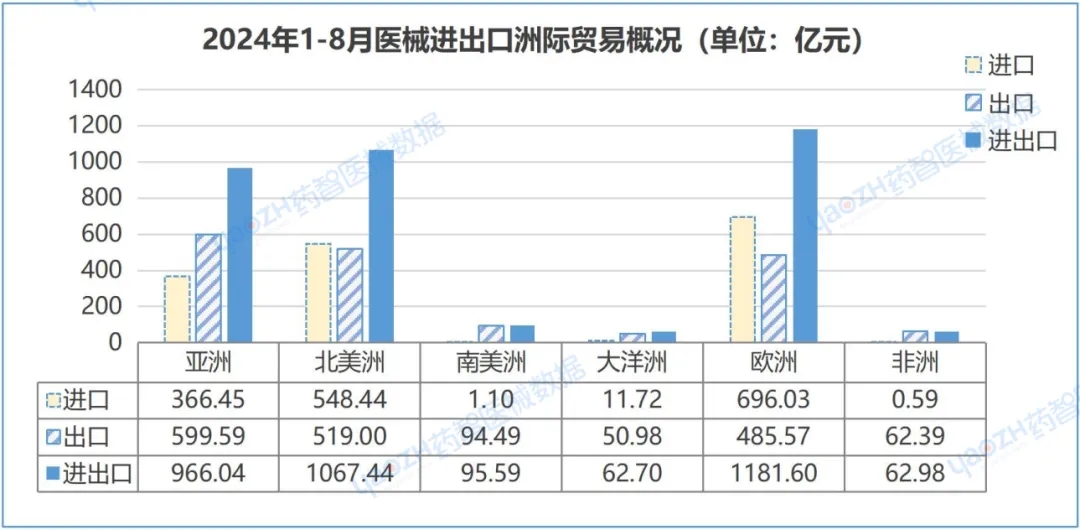
In August 2024, China's equipment trade was mainly concentrated in Europe and North America, accounting for 33.05% and 32.89%, respectively, with a total trade volume of 14.930 billion yuan and 14.857 billion yuan, respectively. Among them, in terms of exports, the export value of Asia accounted for the first, reaching 30.65%, and the export value was 7.724 billion yuan, an increase of 3.09%; In terms of imports, Europe's import amount accounted for the first, reaching 40.83%, with 8.154 billion yuan of imports, down 15.98% from the previous quarter.
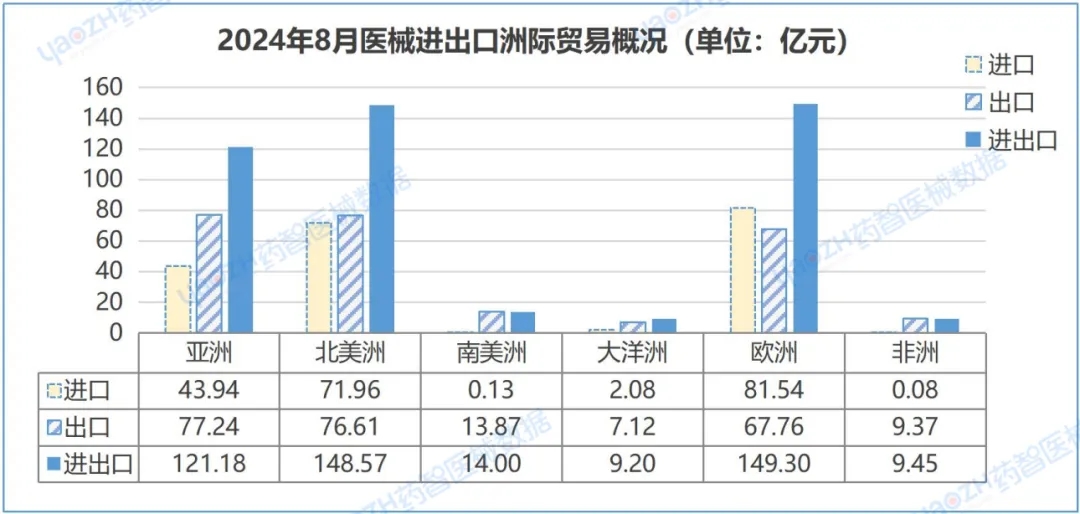
From the overall data from January to August 2024, China's equipment trade is mainly concentrated in Europe and North America, accounting for 34.39% and 31.06%, respectively, and the total trade is 118.166 billion yuan and 106.744 billion yuan, respectively. Among them, in terms of exports, the export value of Asia accounted for the first, reaching 33.09%, and the export value was 59.959 billion yuan, down 30.15% from the previous quarter; In terms of imports, Europe's import amount accounted for the first, reaching 42.85%, and imports 69.603 billion yuan, down 31.11% from the previous quarter;
2. Trade of countries along the Belt and Road
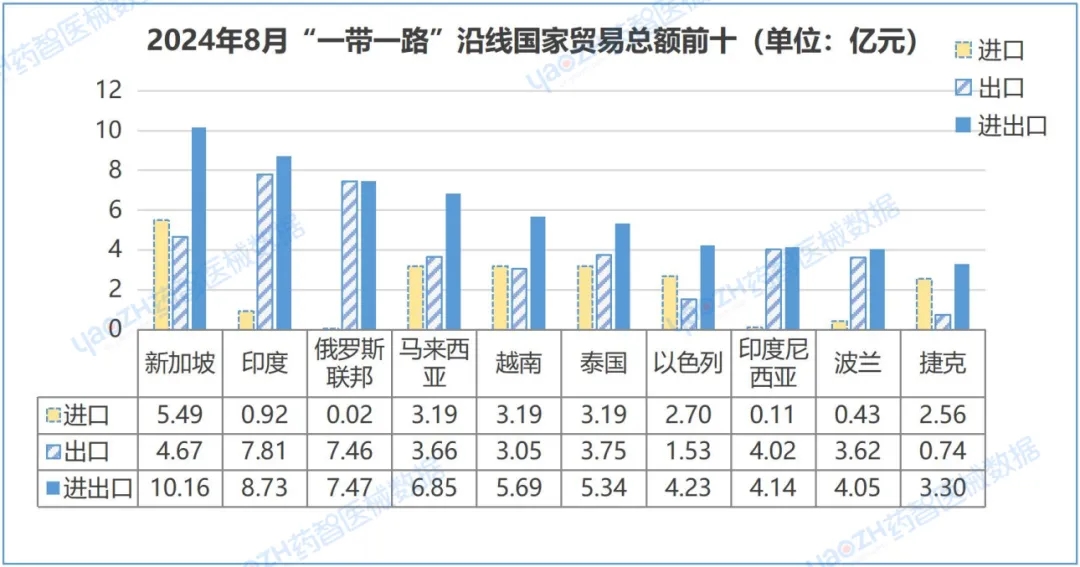
In August 2024, China's imports and exports along the "Belt and Road" were 8.487 billion yuan, accounting for 18.79% of China's total global trade, down 5.74% from the previous month. Among them, the export of 6.209 billion yuan, accounting for 24.64% of China's total exports, an increase of 2.8%; Imports were 2.278 billion yuan, accounting for 11.41% of China's total imports, down 23.14% from the previous quarter. Imports and exports to Singapore, India, the Russian Federation, Malaysia and Vietnam were 1.016 billion yuan, 873 million yuan, 747 million yuan, 685 million yuan and 569 million yuan, respectively, accounting for 45.85% of the total value of China's imports and exports to countries along the "Belt and Road" in the same period.
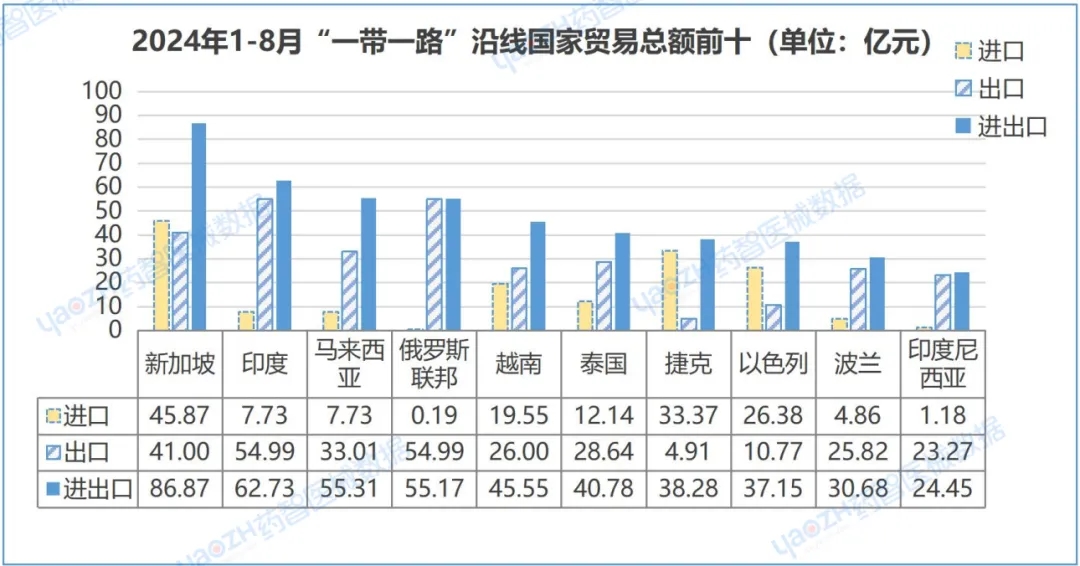
From January to August 2024, China's imports and exports along the "Belt and Road" were 67.58147 million yuan, accounting for 19.67% of China's total global trade, down 28.15% from the previous month. Among them, exports 47.502 billion yuan, accounting for 26.21% of China's total exports, down 27.9%; Imports reached 20.8 billion yuan, accounting for 12.36% of China's total imports, down 28.75% from the previous quarter. China's imports and exports to Singapore, India, Malaysia, the Russian Federation and Vietnam were 8.687 billion yuan, 6.273 billion yuan, 5.531 billion yuan, 5.517 billion yuan and 4.555 billion yuan respectively, accounting for 45.22% of the total value of China's imports and exports to countries along the "Belt and Road" in the same period.
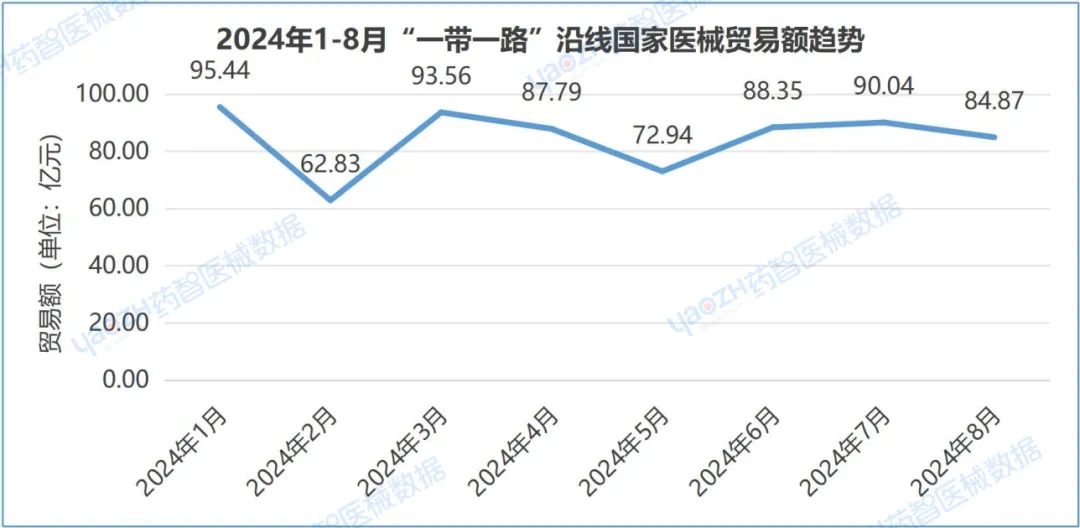
From January to August 2024, China's total trade of imports and exports along the "Belt and Road" routes decreased by an average of 1.66%; The average value of exports fell by 0.67%; Imports fell by an average of 0.40 per cent.
3. Trade of RCEP member countries
In August 2024, China's imports and exports to RCEP countries reached 9.717 billion yuan, accounting for 21.51% of China's total global trade, down 1.08% from the previous month. Among them, the export of 5.789 billion yuan, accounting for 22.98% of China's total exports, an increase of 5.85%; Imports reached 3.927 billion yuan, accounting for 19.66% of China's total imports, down 9.78% from the previous quarter. China's imports and exports to Japan, South Korea, Singapore, India and Australia were 3.154 billion yuan, 1.093 billion yuan, 1.016 billion yuan, 873 million yuan and 793 million yuan, respectively, accounting for 71.31% of the total value of China's imports and exports to RCEP countries in the same period.
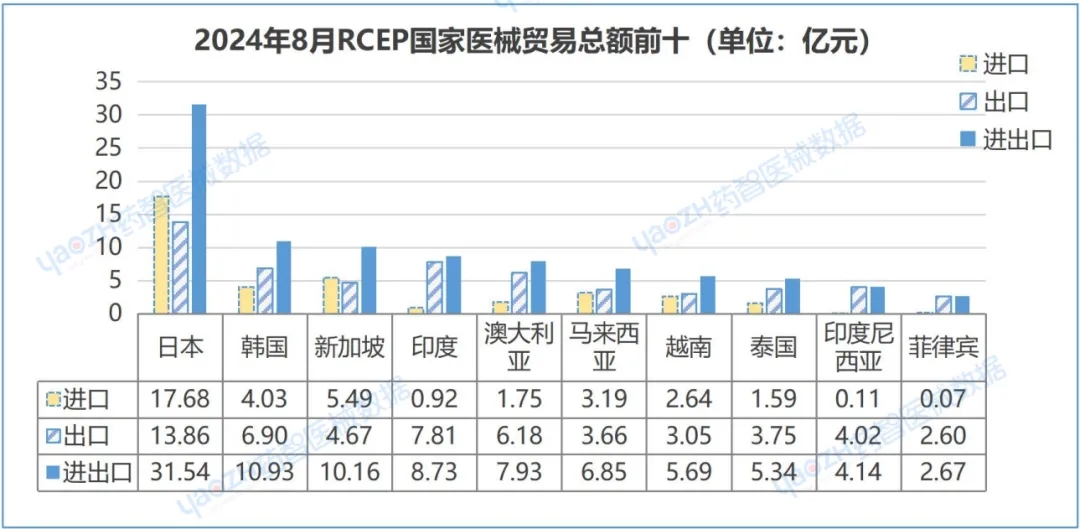
3. Trade of RCEP member countries
From the overall data from January to August 2024, China's imports and exports to RCEP countries were 77.231 billion yuan, accounting for 22.47% of China's total global trade, down 30.93% from the previous month. Among them, exports 44.524 billion yuan, accounting for 24.57% of China's total exports, down 29.14%; Imports reached 32.707 billion yuan, accounting for 20.14% of China's total imports, down 33.23% from the previous quarter. Imports and exports to Japan, South Korea, Singapore, India and Malaysia were 26.375 billion yuan, 9.146 billion yuan, 8.687 billion yuan, 6.273 billion yuan and 5.531 billion yuan respectively, accounting for 72.52% of the total value of China's national imports and exports to RCEP countries in the same period.
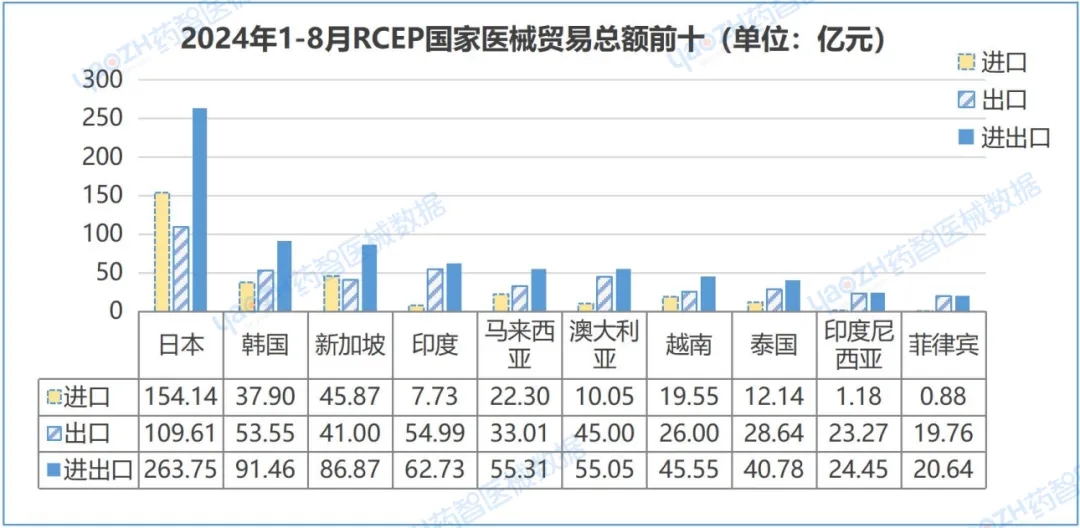
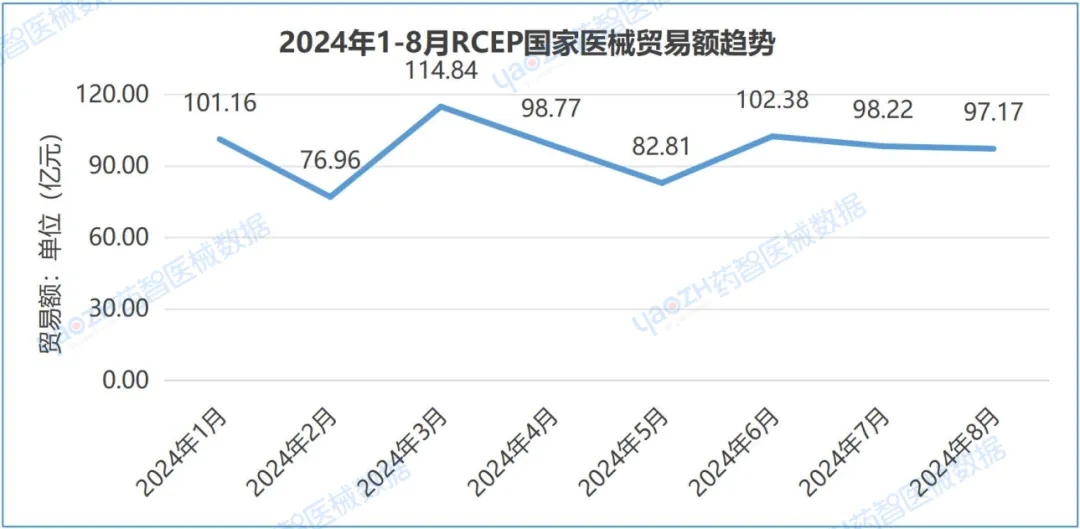
From January to August 2024, China's total trade with RCEP countries fell by 0.57% on average; The average value of exports fell by 0.82%; Imports fell by an average of 0.2%.
4. Trade among ASEAN countries
In August 2024, China's import and export to ASEAN countries reached 4.415 billion yuan, accounting for 9.77% of China's total global trade, a month-on-month increase of 1.82%. Among them, the export was 3.01 billion yuan, accounting for 11.95% of China's total exports, an increase of 5.72%; Imports reached 1.405 billion yuan, accounting for 7.03% of China's total imports, down 5.65% from the previous quarter. China's imports and exports to Singapore, India and Malaysia were 1.016 billion yuan, 873 million yuan and 685 million yuan respectively, accounting for 58.31% of the total value of China's imports and exports to ASEAN countries in the same period.
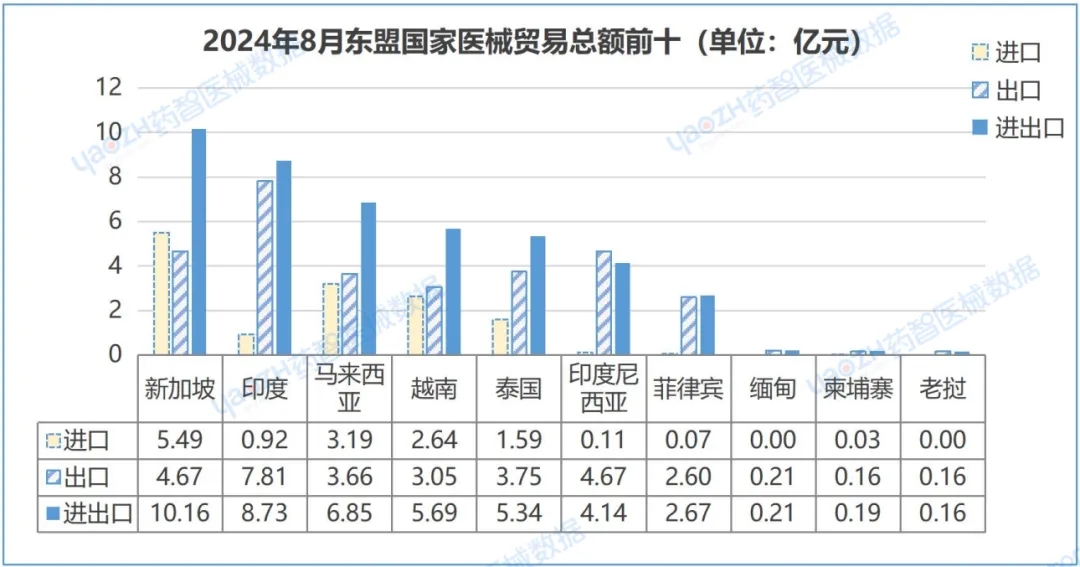
From the overall data from January to August 2024, China's imports and exports to ASEAN countries were 34.161 billion yuan, accounting for 9.94% of China's total global trade, down 29.63% from the previous month. Among them, exports were 23.171 billion yuan, accounting for 12.79% of China's total exports, down 27.76% from the previous quarter; Imports reached 10.990 billion yuan, accounting for 6.77% of China's total imports, down 33.27% from the previous quarter. China's imports and exports to Singapore, India and Malaysia were 8.687 billion yuan, 6.273 billion yuan and 5.531 billion yuan respectively, accounting for 59.98% of the total value of China's imports and exports to ASEAN countries in the same period
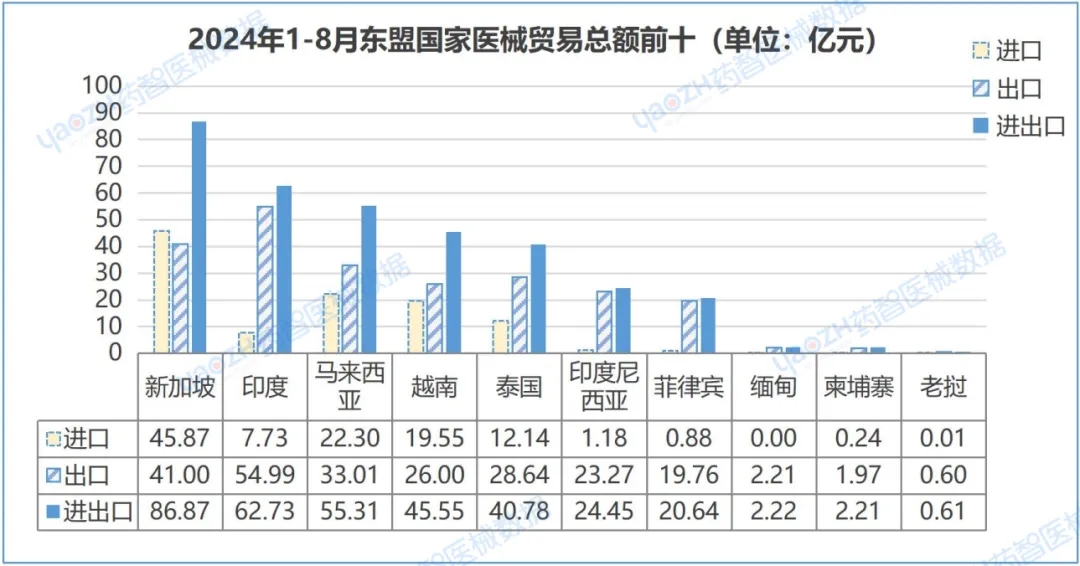
From January to August 2024, China's total trade with ASEAN countries decreased by 0.04% on average; The average value of exports fell by 0.01%; Imports fell by an average of 0.11 per cent.
5. Trade in key countries or regions
In August 2024, China's main trading partners for medical devices were the United States, Germany, Japan, Mexico and the United Kingdom, with a total import and export trade of 23.233 billion yuan, accounting for 51.43% of China's total global trade volume, an increase of 2.57% from the previous month. Among them, the total export trade was 10.78 billion yuan, accounting for 42.61% of China's total exports, an increase of 9.9%. The total import trade was 12.495 billion yuan, accounting for 62.56% of China's total imports, down 2.98% from the previous quarter.
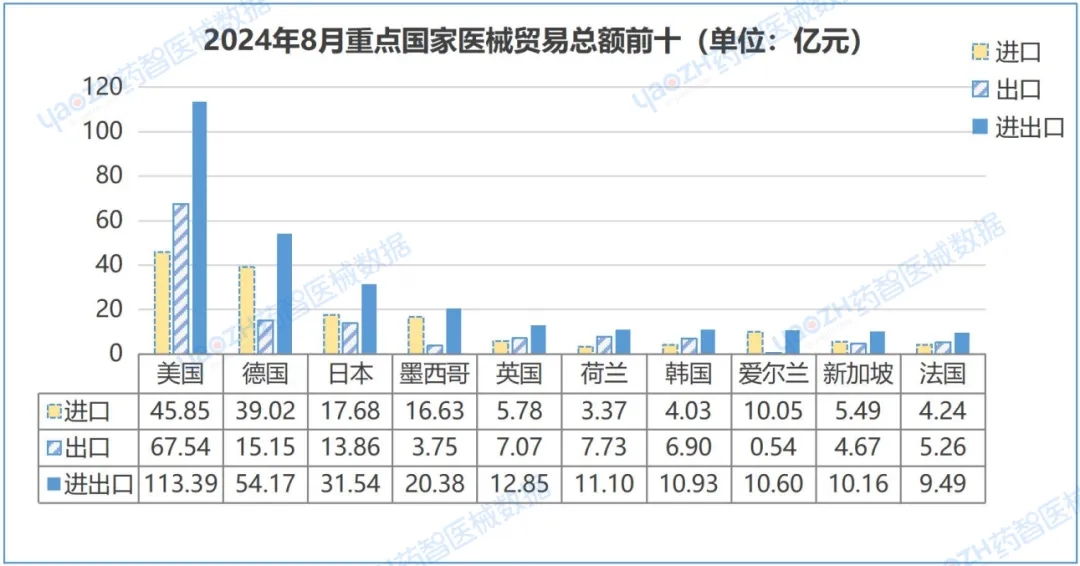
From the overall data from January to August 2024, China's main trading partners for medical devices are the United States, Germany, Japan, Mexico and the Netherlands, with a total import and export trade of 174.128 billion yuan, accounting for 50.67% of China's total global trade volume, down 30.29% from the previous month. Among them, the total export trade was 75.094 billion yuan, accounting for 41.44% of China's total exports, down 26.69% from the previous quarter. Import trade totaled 99.035 billion yuan, accounting for 60.97% of China's total imports, down 32.8% from the previous quarter.
4. Foreign trade analysis of provinces and cities
1. Overall trend
From the analysis of import and export trade volume of various provinces, in August 2024, China's medical device imports and exports were mainly concentrated in Shanghai, Guangdong Province and Jiangsu Province, respectively, 13.798 billion yuan, 8.330 billion yuan and 5.561 billion yuan, accounting for 61.30% of China's total import and export trade volume, down 1.78% from the previous month. Among them, in terms of exports, the total exports of Guangdong Province, Jiangsu Province and Zhejiang Province ranked the top three, and the highest month-on-month growth of exports in August 2024 was in Zhejiang Province, with a month-on-month growth of 8.85%; In terms of imports, Shanghai, Beijing and Guangdong Province ranked the top three, and the lowest month-on-month decline in imports in August 2024 was in Shanghai, which fell 4.43% month-on-month
2. Beijing-tianjin-hebei Region
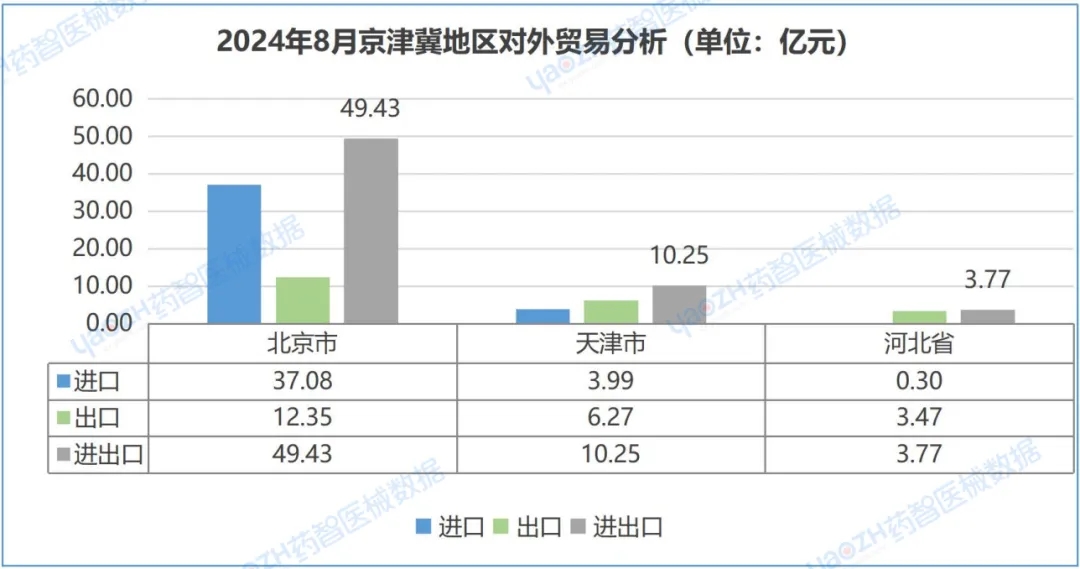
From the analysis of import and export trade volume in the Beijing-Tianjin-Hebei region, the total import and export trade volume of medical devices in August 2024 was 6.345 billion yuan, accounting for 14.05% of China's total import and export trade volume.
3. Yangtze River Delta
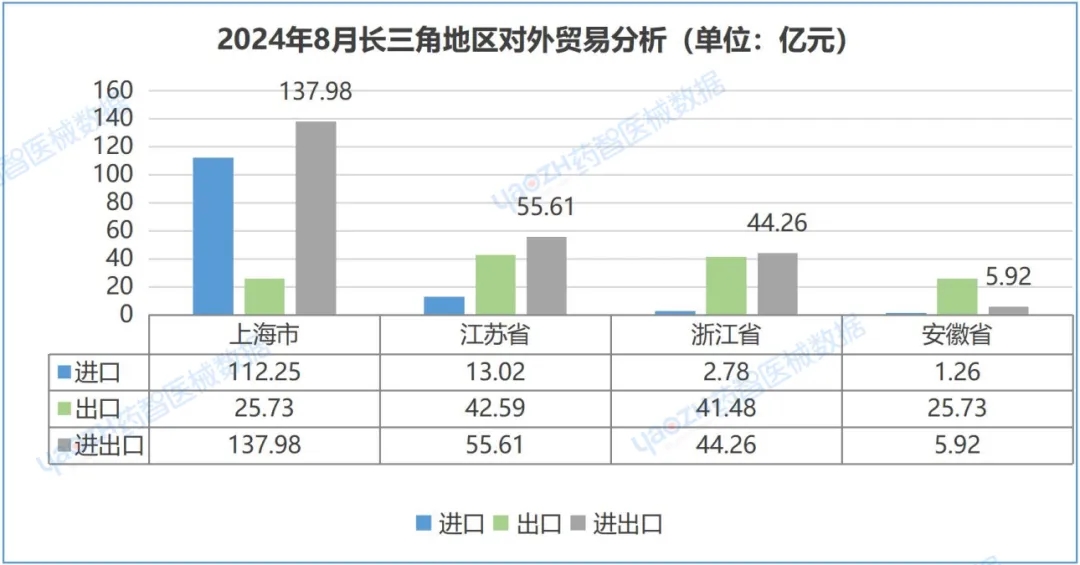
From the analysis of the import and export trade volume in the Yangtze River Delta region, the total import and export trade volume of medical devices in August 2024 was 24.378 billion yuan, accounting for 53.97% of China's total import and export trade volume.
|
Last:Reproduced: Exclusive! Panoramic map of Jiangxi pharmaceutical industry chain in 2024
Next:Reproduced: Blockbuster! Panorama of Jiangsu medical device industry chain in 2024 |
Return |